What Can Global Customs Data Tell You About a Buyer’s Purchasing Behavior? - TradeSaya
What Can Global Customs Data Tell You About a Buyer’s Purchasing Behavior?
Every inquiry looks promising until it goes silent. You respond to a buyer, prepare a quote, and then nothing. The problem is you cannot see whether that buyer is genuinely active or just collecting prices. Customs data changes that. It reveals a buyer’s purchasing behavior in detail: purchase frequency, volume trends, supplier relationships, and price signals. Instead of guessing from a website or a generic email, you can analyze shipment records to qualify leads and personalize your outreach. Here are the key signals hidden in trade data and how to use them.
Purchase Frequency and Volume Trends
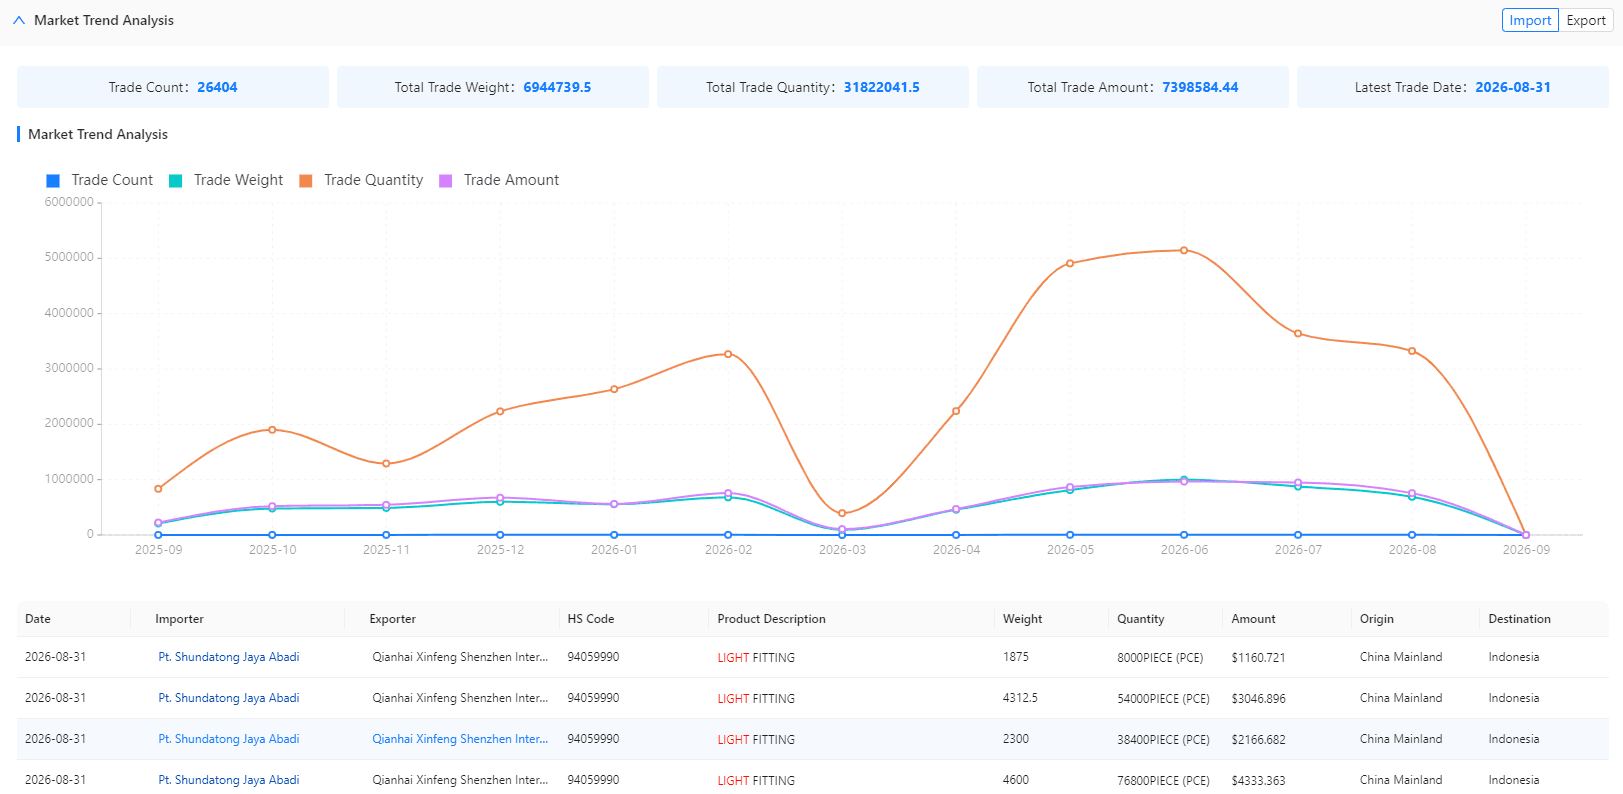
The first thing to check in customs data is how often a buyer imports and how much they buy. A buyer who imports every month is fundamentally different from a buyer who imports once a year. High-frequency buyers have steady demand and need reliable supply chains. Low-frequency buyers may be project-based or just entering the market.
Volume trends are equally important. A buyer whose import volume is growing quarter over quarter is a growth-stage company—an ideal prospect. A buyer whose volume is flat may be satisfied with their current supplier. A buyer whose volume is declining may be facing financial trouble or changing product lines.
TradeSaya visualizes purchase frequency and volume trends on a timeline, so you can immediately see patterns without exporting data to spreadsheets.
>>> Request a Free Demo from TradeSaya <<<
Supplier Relationships and Switching Behavior
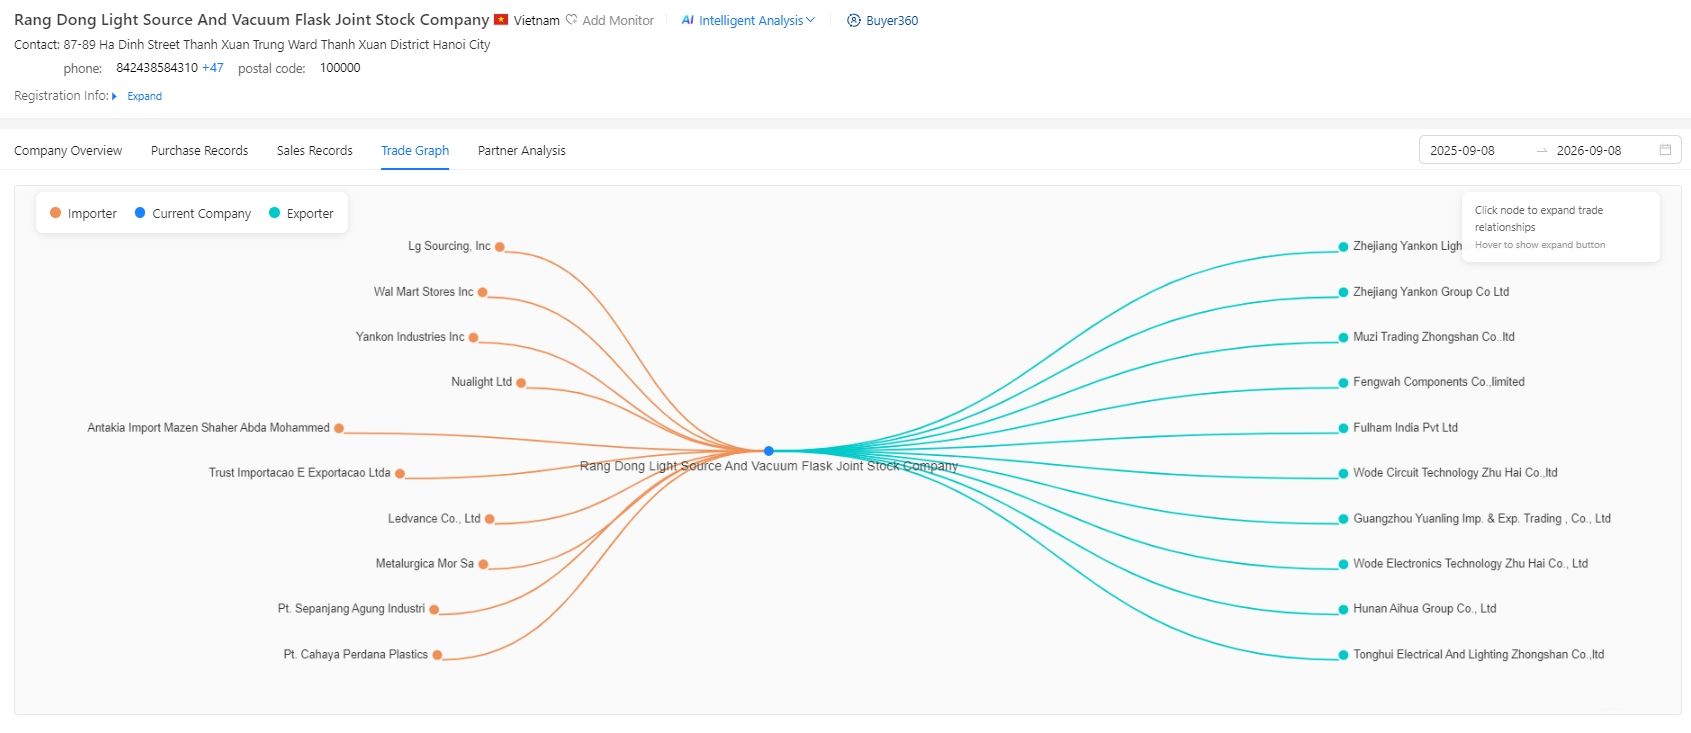
Every customs record includes the exporter’s name and country. By analyzing a buyer’s shipment history, you can build a picture of their current supplier base. Do they use one supplier or several? Which countries do they source from? Have they recently changed suppliers?
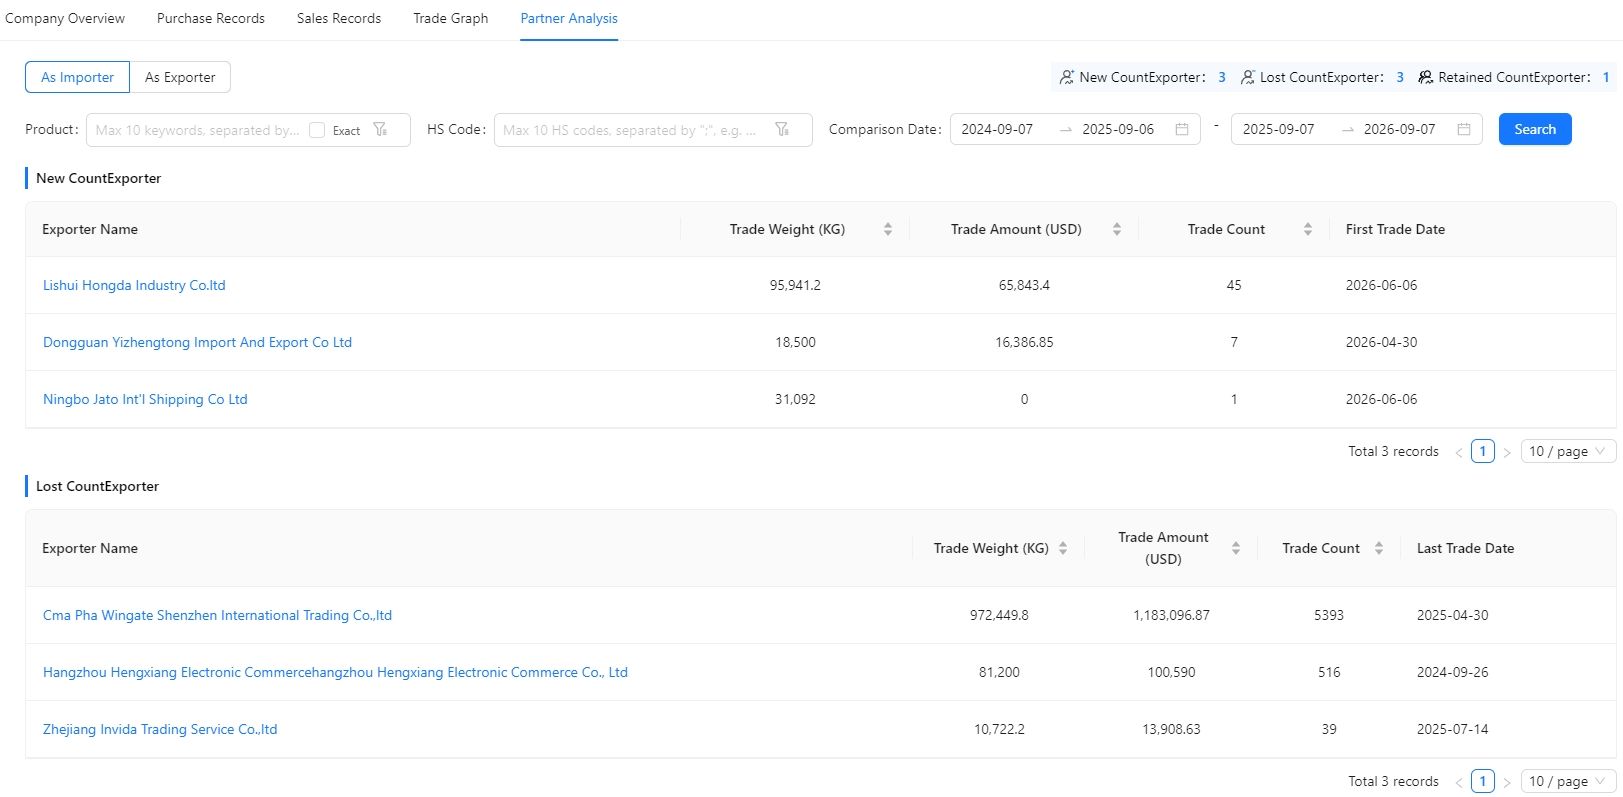
This supplier analysis is critical for finding openings. A buyer who uses multiple suppliers may be open to adding another one. A buyer who sources primarily from one country may be vulnerable to supply chain disruptions. A buyer who recently switched suppliers may be unhappy with their previous provider—that is the best time to enter the conversation.
TradeSaya’s transaction graph makes supplier relationships visual. You can click on a buyer and see their entire supplier network, including who they buy from and how those relationships change over time.
>>> Request a Free Demo of TradeSaya <<<
Price Signals and Cost Baselines
Some customs datasets include the declared value of goods. This is not always the exact final price, but it gives you a useful benchmark for what a buyer is paying. If you know a buyer is importing a product at $3.00 per unit from China, and your production cost allows you to offer $2.80 with similar or better quality, you can craft a highly targeted pitch. You are not just another supplier; you are a direct cost-saving alternative.
Even when exact price data is not available, you can often infer price ranges from shipment weight, volume, and product type. This information helps you position your offer before you ever contact the buyer. For instance, if you see that a buyer imports large volumes of cotton fabric from India at a declared value suggesting around $2.50 per meter, and you can supply at $2.30 per meter from Pakistan, you can mention that specific cost advantage in your first message.
TradeSaya includes price-related insights where available, helping you understand the buyer’s purchasing power and psychological price range before you negotiate.
How TradeSaya Presents Buyer Behavior in One Dashboard
The biggest challenge with customs data is information overload. A buyer may have dozens of shipments, and sifting through them manually is time-consuming. TradeSaya solves this with a dedicated buyer analysis dashboard. When you open a buyer’s profile, you see:
- A timeline of their shipment history
- Volume and frequency trends
- A list of their current and past suppliers
- Changes in supplier relationships
- Direct contact information for key decision-makers
This dashboard transforms raw trade data into a clear story about the buyer’s behavior. You do not need to be a data analyst to understand it. You just need to look at the charts and decide who to contact first.
Final Thoughts: Behavior Beats Assumption
Assumptions kill sales. When you assume a buyer is serious because their inquiry looks professional, you risk wasting hours on a dead end. When you assume a buyer is small because their website is basic, you risk missing a high-volume importer. Customs data removes assumptions. It shows you exactly what a buyer does in the global market. Purchase frequency, volume trends, supplier relationships, and price signals together paint an accurate picture of their purchasing behavior. The exporters who succeed will be those who base their sales strategy on verified behavior, not on marketing profiles.
TradeSaya gives you the tools to do that—see the buyer, understand their behavior, and reach them directly, all in one platform.
Frequently Asked Questions
Q: Can customs data show exactly how much a buyer paid for a shipment? A: Some records include declared value, which is a useful benchmark but may not reflect the final negotiated price. It still helps you understand the buyer’s price range. Q: Does customs data include buyer contact information? A: Raw customs data rarely includes direct emails or phone numbers. Platforms like TradeSaya enrich shipment records with verified contact details for decision-makers. Q: Is it legal to use customs data for sales prospecting? A: Yes, customs data is based on publicly filed trade records and is widely used for market research and B2B sales. Always use it respectfully and in compliance with data protection laws.